


Author:- Mr. Ritesh Sharma
An electrocardiogram is an essential diagnostic test in the domain of cardiac care. Through this test, the electrical activity of the heart is measured and various abnormalities are detected. This test has an ECG values chart that contains all of its components. Understanding this chart is pivotal for interpreting the results of the ECG test accurately. The normal ECG values chart give vivid insights into the impulses produced by the heart during its electrical activity which are illustrated in the recording device.
The intricacies of the normal ECG values hold great significance in healthcare. Without learning about the normal ECG values chart, no healthcare professionals can determine the heart abnormalities in the ECG test. Therefore, in this blog, we will discuss all normal ECG values in all of their complexities. This includes a basic understanding of the ECG waveform, normal ECG values, additional parameters, clinical applications of normal ECG values chart, and more.
Understanding the ECG Waveform
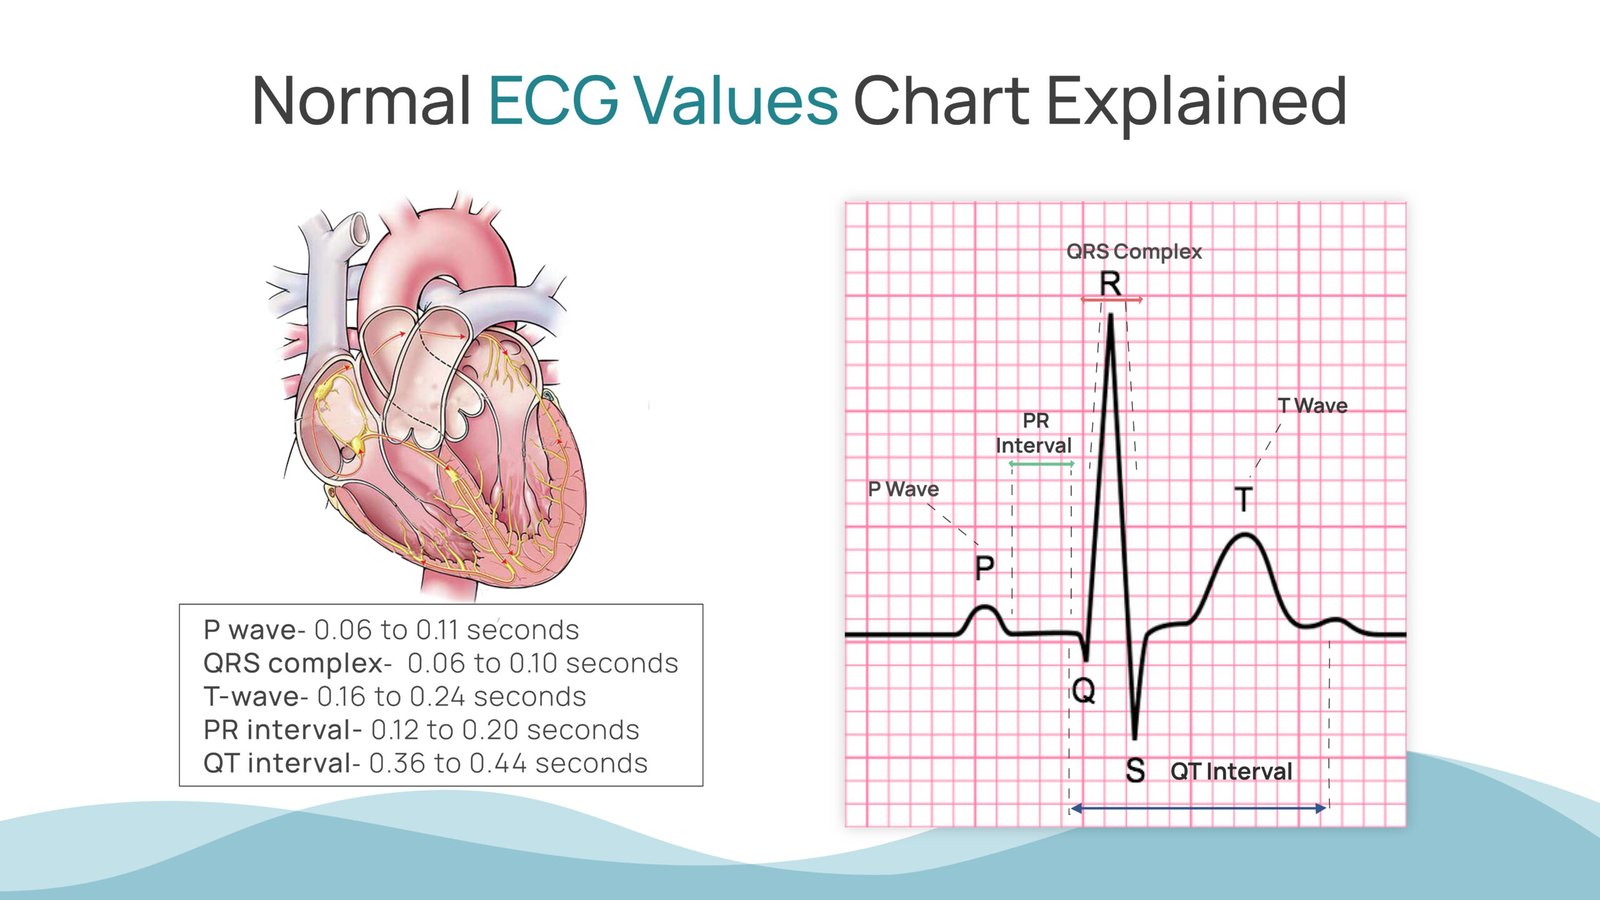
The ECG waveform consists of several components with each component representing a different electrical event within the heart. These components are as follows: P-wave, QRS complex, and T-wave. In this waveform, the P-wave represents the atrial depolarization, the QRS complex represents the ventricular depolarization and the T-wave represents the ventricular repolarization. In an electrocardiogram test report, the morphology and duration of all these components are gauged to identify the electrical activity of the heart. These components give insights into cardiac function and identify abnormalities.
Normal ECG Values Chart First Component- P Wave
In the standard electrocardiogram, the duration of the P wave is 0.06 to 0.11 seconds. Moreover, the amplitude of the P wave is up to a height of 2.5 mm. Deviations from these standard units indicate P-wave ECG abnormalities. A normal P-wave is an indicator of normal depolarization. In this, electrical impulses initiate from the natural pacemaker of the heart, i.e. sinoatrial node, and propagate through the upper chambers of the heart, i.e. atria.
Normal ECG Values Chart Second Component- QRS Complex
The QRs complex represents ventricular depolarization. In this, the electrical impulses originating from the SA node spread through the ventricles. A normal QRS complex has a duration that ranges from 0.06 to 0.10 seconds. Furthermore, the amplitude of the complex is up to a height of 5mm. Deviations from these standard units indicate QRS complex abnormalities.
Normal ECG Values Chart Third Component- T Wave
The T wave represents ventricular repolarization signifying the recovery phase of the ventricles post-depolarization. In the standard electrocardiogram, the T-wave has a duration that ranges from 0.16 to 0.24 seconds. Additionally, the amplitude of the T-wave is of a height of up to 5 mm. Deviations from these standard units can indicate T-wave abnormalities that can cause electrolyte imbalances, myocardial ischemia, or other cardiac abnormalities.
Additional ECG Parameters
Apart from the basic ECG components, there are some additional ECG parameters in the normal ECG values chart as well. Through these additional parameters, we get insights into various cardiac functions. These additional parameters include PR Interval, QT interval, and heart rate.
Normal ECG Values- PR Interval
The PR interval represents the time period from the atrial depolarization (P-wave) to the ventricular depolarization (QRS complex). In a normal PR interval, the time period taken ranges from 0.12 to 0.20 seconds. This time period reflects the conduction of electrical impulses from the atria to the ventricles through the atrioventricular node or AV node. If this interval is long then it leads to a heart dysfunction called prolonged PR Interval causing an abnormal ECG.
Normal ECG Values- QT Interval
The QT interval is the complete duration between the ventricular depolarization (QRS complex) and repolarization (T-wave). The QT interval varies with heart rate, i.e. factors like slow heart rate- bradycardia and elevated heart rate- heart palpitations. However, it typically ranges from 0.36 to 0.44 seconds at a heart rate of 60 to 100 beats per minute. Any deviation from this unit can be likely due to irregular heart, i.e. cardiac arrhythmia.
Normal ECG Values- Heart Rate
Heart rate, normally expressed in beats per minute, is a critical factor in the assessment of an electrocardiogram. The resting heart rate in individuals lies between 60 to 100 beats per minute with variations observed based on age, fitness level, and other factors. Any abnormalities in the heart rate cause arrhythmias of different arrhythmia classifications, such as bradycardia, monomorphic ventricular tachycardia, atrial fibrillation, atrial flutter, etc.
Clinical Applications of Normal ECG Values
Understanding the normal ECG values chart is of critical importance for healthcare professionals in clinical settings. The importance of this ranges from screening individuals for cardiovascular risk factors to diagnosing cardiac arrhythmias and monitoring response to treatment. Apart from this, normal ECG values also let healthcare professionals differentiate between benign variations and pathological conditions. This further guides them to adopt the relevant treatment strategies.
Recommendations for Further Learning
In conclusion, learning about the normal ECG values chart and additional parameters is necessary for all healthcare professionals. It lets them know the nuances of each ECG waveform and the additional parameters with utmost precision. Through a deep understanding of the normal ECG values chart, healthcare professionals can easily distinguish between normal cardiac activity and pathological conditions.
Therefore, they get help deciding the correct treatment options tailored for various patients. With the constant exponential advancements in technology, continued education and training in ECG interpretation have become paramount for all healthcare professionals who always strive to deliver the highest quality of cardiac care to patients.
Conclusion
A clear understanding of normal ECG values is not just an academic requirement but a practical necessity in modern cardiac care. When healthcare professionals are confident in reading the P wave, QRS complex, T wave, and critical intervals like PR and QT, they are better equipped to identify early deviations that may signal serious cardiac concerns. This knowledge transforms an ECG report from a simple waveform into a powerful clinical decision-making tool.
As cardiac diseases continue to rise and patient loads increase across clinical settings, the need for accurate, quick, and accessible ECG interpretation becomes even more important. This is where technology plays a transformative role. Portable and intelligent ECG solutions are enabling clinicians to capture reliable readings anytime and anywhere without compromising on diagnostic quality.
Innovations by Sunfox Technologies are aligned with this evolving need in healthcare. By making clinical-grade ECG devices more accessible, user-friendly, and suitable for diverse environments—from hospitals to remote health camps—Sunfox is supporting healthcare professionals in applying their ECG knowledge effectively at the point of care.
Ultimately, mastering the normal ECG values chart, combined with the right diagnostic tools, empowers clinicians to deliver faster detection, timely intervention, and improved cardiac outcomes for patients everywhere.